
一、安装MySQL
1.安装MySQL源
rpm -ivh https://dev.mysql.com/get/mysql84-community-release-el8-1.noarch.rpm2 安装MySQL
yum -y install mysql-serv启动MySQL
systemctl start mysqld
systemctl enable mysqld
4 初始化MySQL
[root@ser8250ww51293157 mysqld_dir]# mysql -u root -p
Enter password:   ##直接回车
Welcome to the MySQL monitor.  Commands end with ; or \g.
Your MySQL connection id is 8
Server version: 8.4.2

Copyright (c) 2000, 2024, Oracle and/or its affiliates.

Oracle is a registered trademark of Oracle Corporation and/or its
affiliates. Other names may be trademarks of their respective
owners.

Type 'help;' or '\h' for help. Type '\c' to clear the current input statement.

mysql> ALTER USER 'root'@'localhost' IDENTIFIED BY 'bK5y3QL22!Zi268V@C3';
Query OK, 0 rows affected (0.01 sec)

mysql>
5 创建账号
mysql> CREATE USER 'mysqld_exporter'@'localhost' IDENTIFIED BY '45bz32ee23463XQRSY';
Query OK, 0 rows affected (0.17 sec)


mysql> GRANT PROCESS, REPLICATION CLIENT, SELECT ON *.* TO 'mysqld_exporter'@'localhost';
Query OK, 0 rows affected (0.02 sec)
mysql> flush privileges;
Query OK, 0 rows affected (0.01 sec)


mysql> quit
Bye
二、mysqld_exporter
下载mysqld_exporter
下载地址:https://github.com/prometheus/mysqld_exporter/releases
cd /opt
wget https://github.com/prometheus/mysqld_exporter/releases/download/v0.17.2/mysqld_exporter-0.17.2.linux-amd64.tar.gz
解压文件
[root@ser533372384841 opt]# tar -zxvf mysqld_exporter-0.17.2.linux-amd64.tar.gz
mysqld_exporter-0.17.2.linux-amd64/
mysqld_exporter-0.17.2.linux-amd64/LICENSE
mysqld_exporter-0.17.2.linux-amd64/mysqld_exporter
mysqld_exporter-0.17.2.linux-amd64/NOTICE
[root@ser533372384841 opt]#
创建mysqld_exporter用户
sudo useradd -r -s /bin/false mysqld_exporter1.4、启动mysql_expoter工具
创建mysqld_exporter的service文件
vim /etc/systemd/system/mysqld_exporter.service
[Unit]
Description=Prometheus MySQL Exporter
After=network.target

[Service]
User=mysqld_exporter
Group=mysqld_exporter
ExecStart=/opt/mysqld_exporter/mysqld_exporter \
  --config.my-cnf=/opt/mysqld_exporter/mysqld_exporter.cnf \
  --web.listen-address=127.0.0.1:9104
Restart=always

[Install]
WantedBy=multi-user.target
创建配置文件
[client]
user=mysqld_exporter
password=your_password
host=127.0.0.1
port=3306
授权配置文件
sudo chown -R mysqld_exporter:mysqld_exporter /opt/mysqld_exporter
sudo chmod 600 /opt/mysqld_exporter/mysqld_exporter.cnf
启动mysqld_exporter服务
systemctl start mysqld_exporter
systemctl enable mysqld_exporter
访问测试
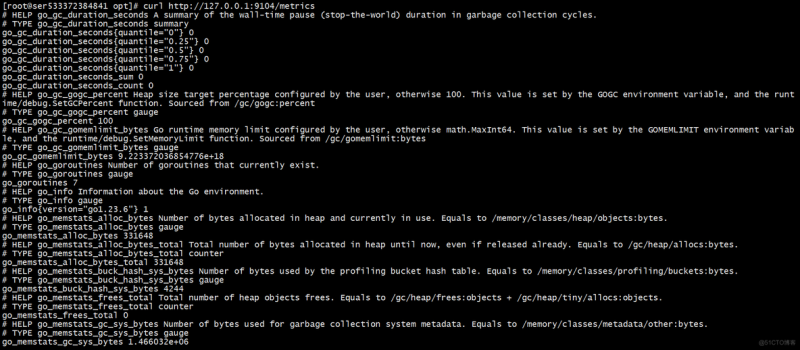
curl http://127.0.0.1:9104/metrics
三、配置Prometheus数据采集
在Prometheus的配置文件中添加mysql的相关job
vim /opt/prometheus/prometheus.yml
添加下面内容
scrape_configs:
  - job_name: 'mysql'
    static_configs:
      - targets: ['localhost:9104']  # 这是 mysqld_exporter 的地址
重启服务
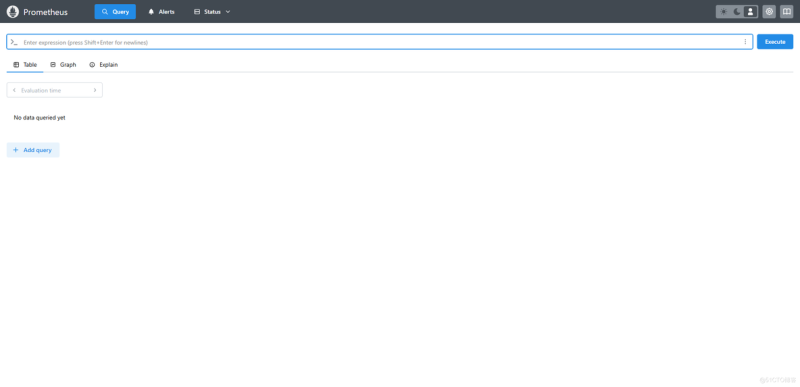
systemctl restatrt prometheus验证指标数据
重新加载Prometheus的配置文件后,Prometheus即可采集到的mysql的指标数据
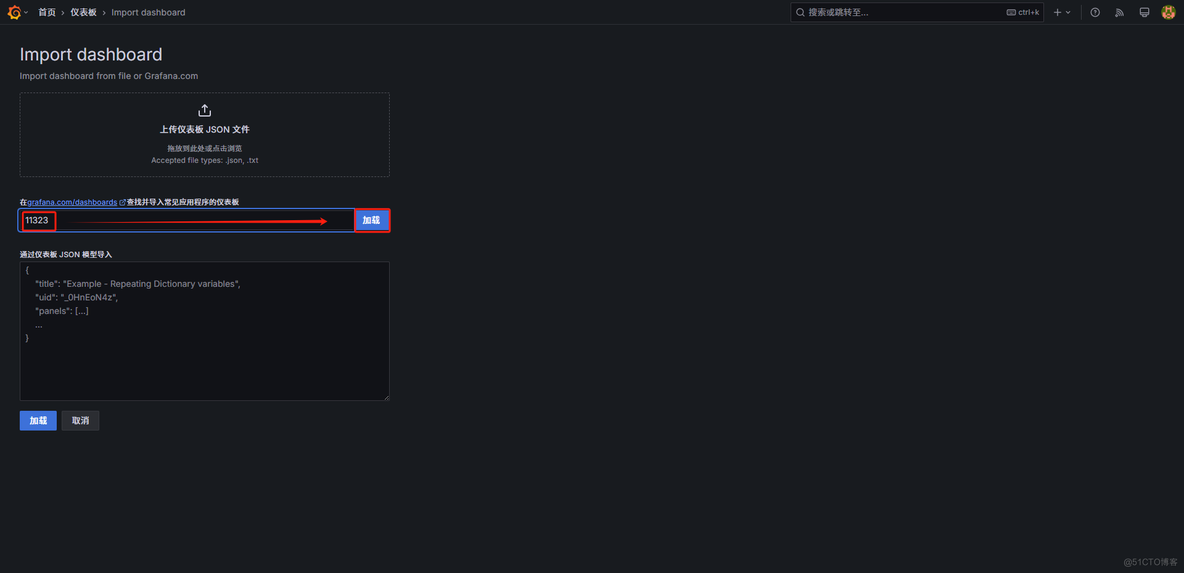
四、Grafana导入mysql监控的模版
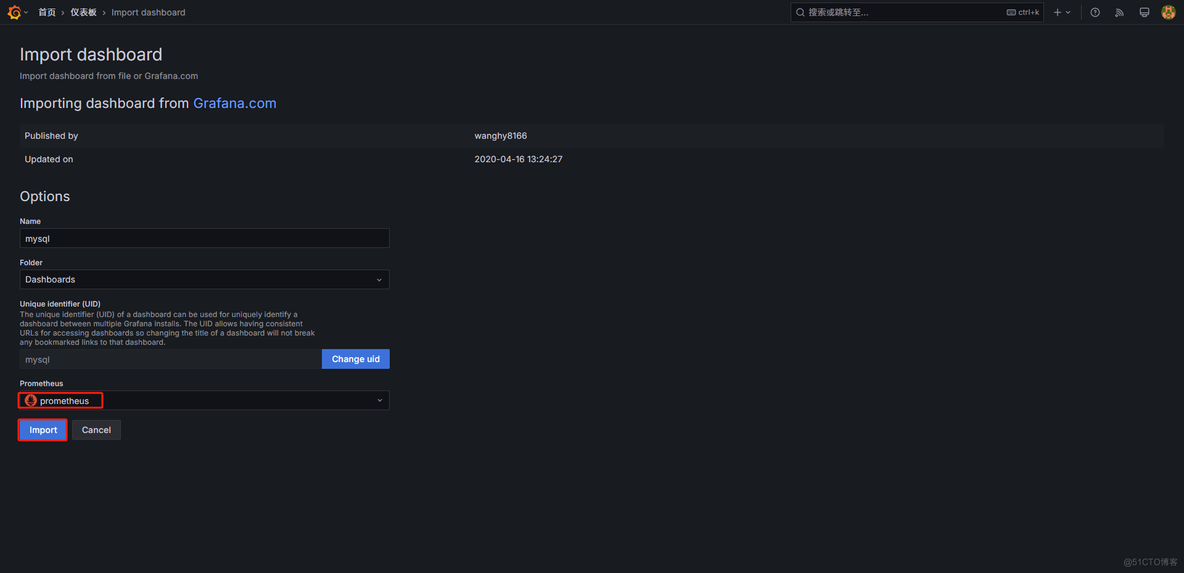
ID:11323
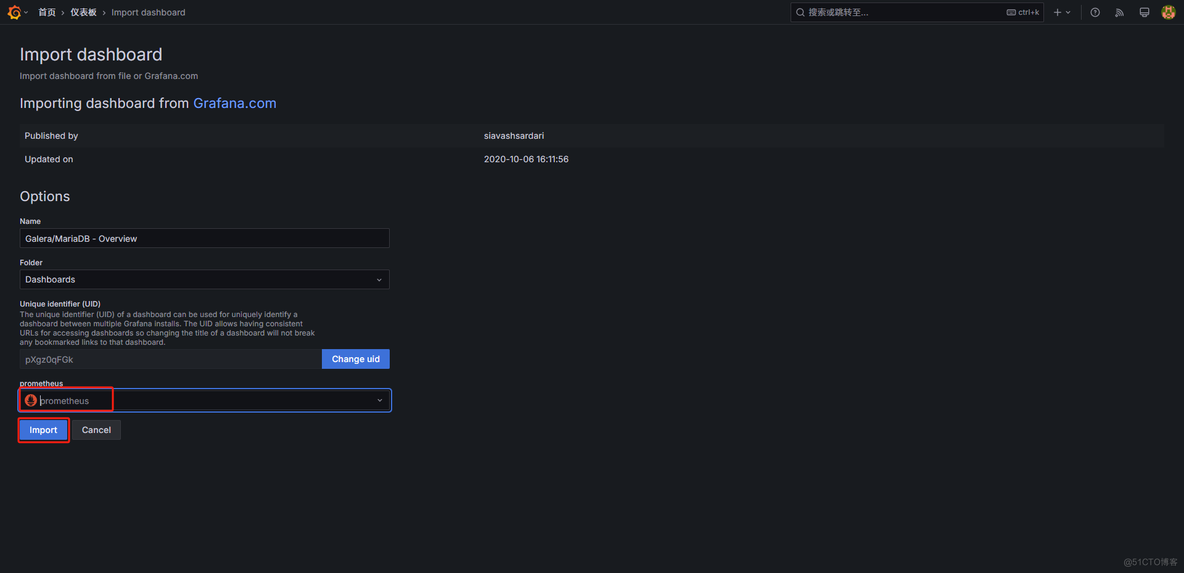
选择数据源
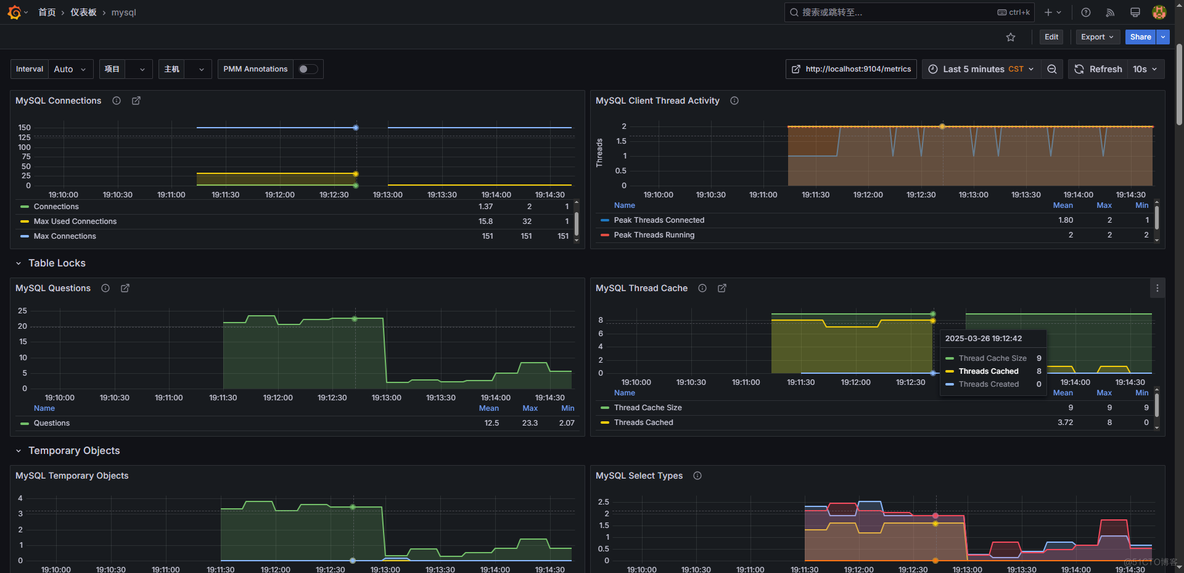
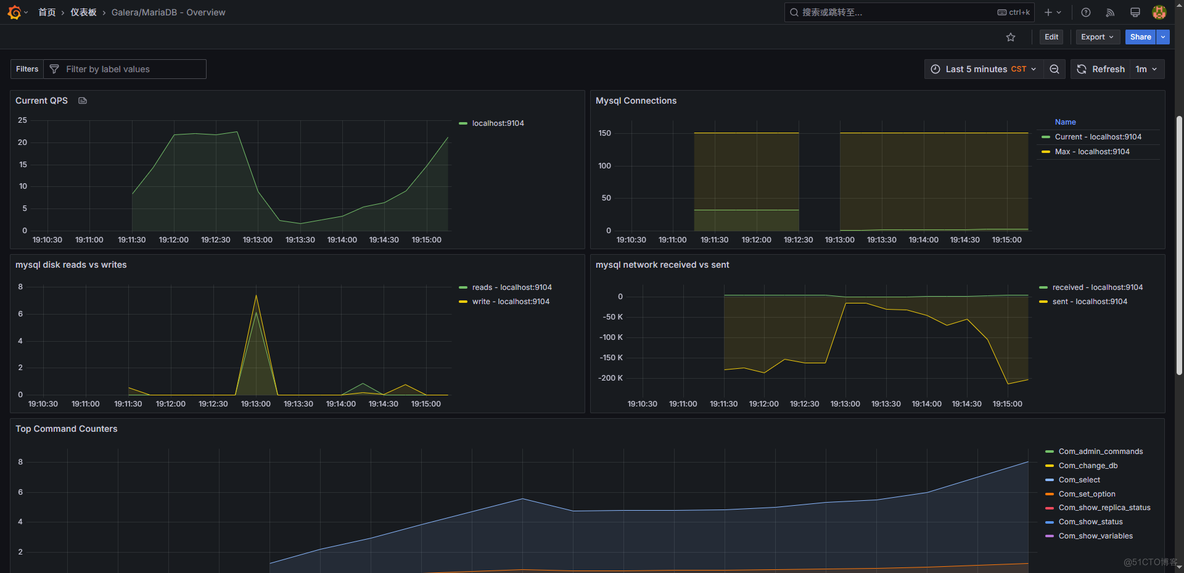
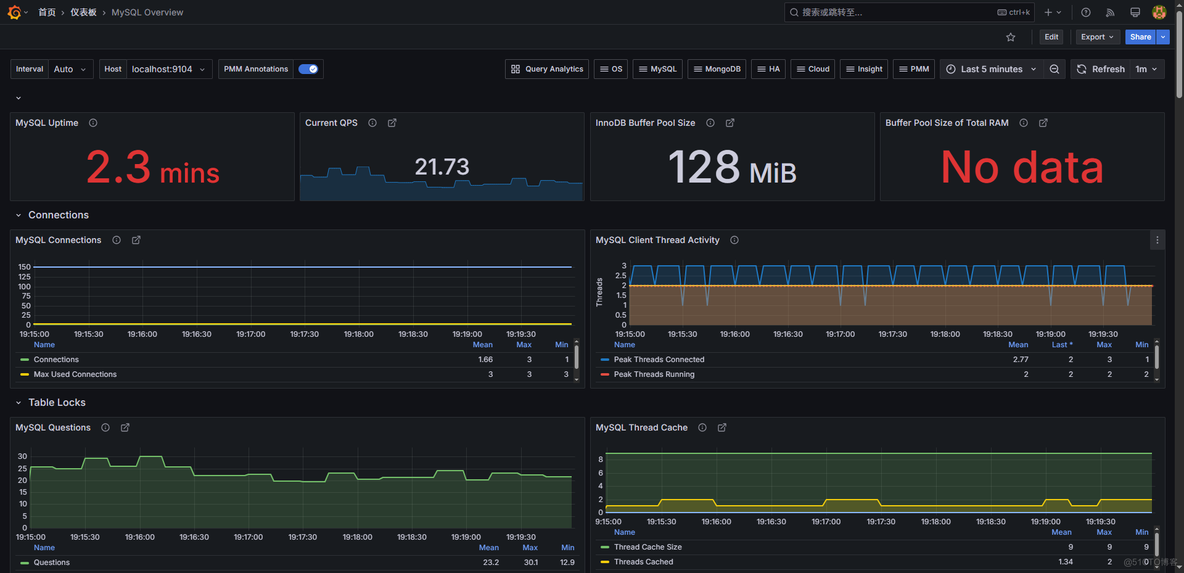
数据展示
ID:13106
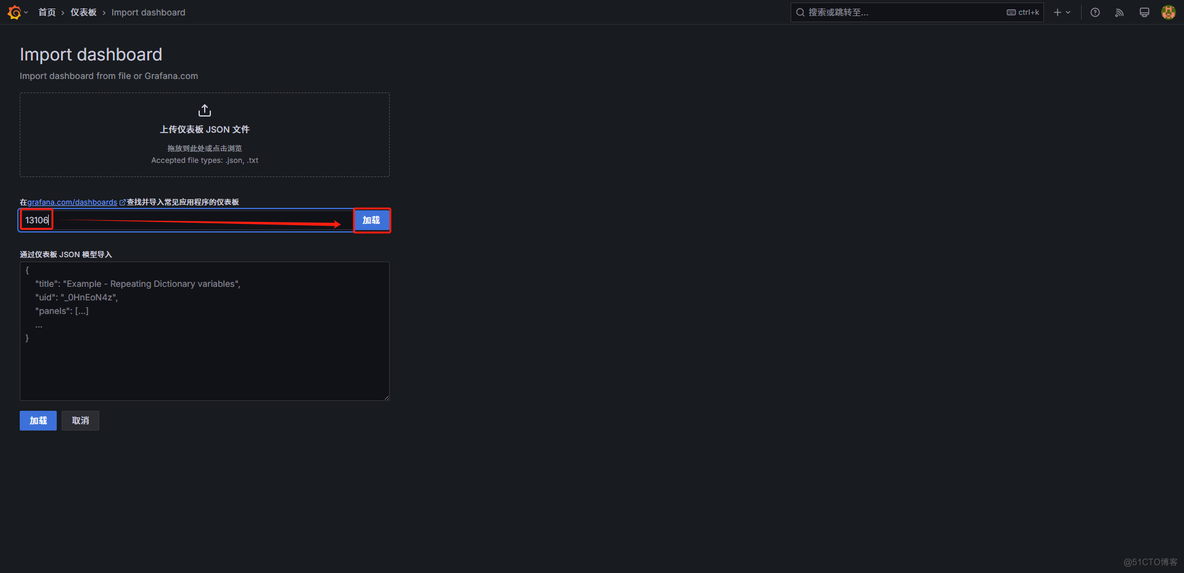
ID:7362
© 版权声明
文章版权归作者所有,未经允许请勿转载。
THE END


暂无评论内容